


The Joint European Torus (JET) gamma-ray camera has been recently upgraded with the installation of new gamma-ray detectors, based on LaBr3(Ce) scintillation crystals, which add spectroscopic capability to the existing system allowing measurements with good energy resolution (5% at 0.622 MeV), a dynamic range from hundreds of keV up to about 30 MeV, and high counting rate capabilities of MCps. First gamma-ray measurements during the C38 campaign of the JET have been successfully carried out, in particular, in D–3He plasmas from three-ion ion cyclotron resonance heating experiments, where the detection of 16.4 MeV γ-rays from D + 3He → γ + 5Li reactions with the gamma-ray camera upgrade allowed determining the spatial profile of alpha particles born in D + 3He fusion reactions.
I. INTRODUCTION
The gamma-ray camera of the Joint European Torus (JET) is a system of 19 detectors that observes the plasma along 10 horizontal and 9 vertical lines of sight (LOS). It has been developed to measure the spatial profile of the gamma-ray emission from nuclear reactions induced by fast ions,1,2 which is of relevance in experiments that aim at studying the physics of MeV range ions in the plasma, such as those obtained by the application of radio-frequency (RF) heating or born from fusion reactions.
In view of the upcoming JET deuterium–tritium (DT) campaign,3 the system has undergone a major upgrade,4–6 within the EUROFUSION enhancement program by the Gamma-ray Camera Upgrade (GCU) project, to meet the demanding conditions for measurements in plasmas at different tritium concentrations. The DT campaign will allow the study of the dynamics of fusion born alpha particles, which is also of interest for ITER;7 thus, the detection of the 4.44 MeV photons emitted in α(9Be, n)12C* reactions under high neutron fluxes will be of crucial importance. This requires detectors with an energy resolution better than 5%@1.1 MeV, counting rate capability >500 kCps, and the capability to operate at magnetic fields of about 100 G. In the past few years, the new system, termed the Gamma Camera Upgrade (GCU), has been equipped with advanced detectors that meet the project requirements (see Ref. 4). This made it possible to use the GCU in recent JET campaigns with deuterium and hydrogen plasmas, before experiments with tritium.
In this paper, we present first results obtained with the GCU in deuterium plasmas at the JET. After a summary of the properties of the new detectors, we describe their energy calibration and the data acquisition (DAQ) system. From the pulse height spectrum measured along each channel of the GCU, we are able to identify spectral features ascribed to fast ion reactions and integrate data in the corresponding energy windows to experimentally determine the projection of the gamma-ray emission profile along the GCU lines of sight (LOS). This, combined with a tomographic inversion and information on the magnetic equilibrium, provides an image of the gamma-ray emission from fast ion reactions in the poloidal plane.8,9 We here present an example from recent Ion Cyclotron Resonance Heating (ICRH) experiments on the three-ion scenario,10–12 where RF waves are used to accelerate a deuterium beam in D–3He mixed plasmas and the GCU determines an image of the alpha particle source born from D + 3He fusion reactions.
II. DATA ACQUISITION AND ENERGY CALIBRATION
The JET gamma-ray camera has been recently upgraded enabling gamma-ray measurements in both deuterium and deuterium–tritium plasmas with neutron yields up to a few 1017 n/s.13 Custom-made detectors based on LaBr3 scintillator crystals and coupled to Silicon PhotoMultiplier (SiPM) matrices have been developed and installed in the camera:4 the new system exhibits an energy resolution better than 3% at 4.44 MeV and a counting rate capability in excess of 1 MCps. SiPMs are compact (12 × 12 mm2 and 2 mm thick) and insensitive to the magnetic field. On the downside, they have a temperature-dependent gain and a non-linear response to the energy deposited in the crystal due to their finite number of pixels. A dedicated read-out board with a real time temperature feedback sensor has been installed as a gain-temperature correction system, whereas the non-linearity has to be considered in the calibration process. The output signal of each detector is fed into a data acquisition (DAQ) system14 that can be operated in three different modes depending on the needs and the expected fluxes. The standard one, which was employed in the measurements described in Sec. IV, stores individual events/waveforms whose amplitude is higher than a preselected value. In experiments where a burst of events is expected in a very short time window of a few hundreds of ms, a continuous storing mode without data loss can be selected. The third mode, instead, takes advantage of a real-time algorithm implemented on the Field Programmable Gate Array (FPGA),15 which allows storing only the pulse height of the event and the time stamp when that occurred.
Dedicated in situ calibration measurements up to about 1.5 MeV are routinely performed at the JET by using the internal activity of 138La and the standard 137Cs, 133Ba, and 22Na radioactive sources embedded in the collimators of the cameras. More rarely, a 241Am–Be neutron/gamma-ray source can be deployed for exploring higher energy regions up to 7.6 MeV. At these energies, the non-linear behavior of the Silicon PhotoMultiplier becomes significant and can be corrected for with a second-degree polynomial calibration (see Fig. 1). As shown in Fig. 1, the 4.44 MeV gamma-ray peak, due to the de-excitation of 12C* created from the 9Be(α, n) 12C* reaction in 241Am–Be source, is clearly visible in the spectrum together with its single and double escape peaks. At higher energies, the single and double escape peaks of the 7.631 MeV prompt gamma ray due to neutron capture in 56Fe can also be observed. In the low energy region, instead, there are two prominent peaks in the spectrum, namely, the 511 keV peak and a gamma-ray peak around 844–847 keV from 27Al neutron activation and/or 55Mn activation, which are also used for calibration. Finally, the high energy end of the dynamic range can be calibrated by extrapolation of the fitted second-degree polynomial between 10 MeV and 20 MeV: such extrapolation is shown in Fig. 1 together with the 95% confidence band of the fit.

(Left) Energy spectrum recorded with the GCU using an Am–Be radioactive source. S.E. and D.E. are the single and double escape peaks due to (from left to right) the 4.44 MeV peak and the prompt photons emitted at 7.63 MeV during the neutron capture on 56Fe. (Right) Quadratic calibration curve for the detectors of the GCU as obtained from the calibration sources at the JET. The fit 95% confidence band is shown in light-blue.
(Left) Energy spectrum recorded with the GCU using an Am–Be radioactive source. S.E. and D.E. are the single and double escape peaks due to (from left to right) the 4.44 MeV peak and the prompt photons emitted at 7.63 MeV during the neutron capture on 56Fe. (Right) Quadratic calibration curve for the detectors of the GCU as obtained from the calibration sources at the JET. The fit 95% confidence band is shown in light-blue.
III. TOMOGRAPHIC RECONSTRUCTION
From the spectrum measured by each GCU detector, we can determine the number of events that fall in an arbitrary energy window. This is proportional to the line integrated emission in that energy band and is here termed the signal, S. As the GCU has 19 channels, S is a vector with 19 entries. When the poloidal plane is divided into 700 pixels (20 rows × 35 columns), the relation between S and the intensity of the gamma-ray emission in the poloidal plane, F, is
where W is a 19 × 700 (rows × columns) transfer matrix. Its i-th–j-th element gives the probability that a photon born within the i-th pixel in the poloidal plane is detected along the j-th channel of the GCU. One aim of the GCU is to determine F from S, which is obtained through a tomographic inversion.8,9
Based on previous experience with the gamma-ray camera at the JET,16,17 we use the Maximum Likelihood-Expectation Maximization (ML-EM)18 method to perform the tomographic inversion. In this method, F is obtained by the iterative formula as follows:
where the superscript n indicates the step of the iteration. As the initial step, we assume a uniform emission profile, i.e., . The reconstruction is interrupted when the correlation between two subsequent iteration steps approaches unity, as in Eq. (5) of Ref. 16.
The transfer matrix W has been evaluated using an ad hoc script, which considers the three-dimensional geometry of the gamma-camera lines of sight (LOS). Additional information needs, however, to be considered for a satisfactory tomographic reconstruction. In our work, we follow the approach of Ref. 16. As W is sparse, due to the limited amount of lines of sight for the GCU, 17 additional, virtual LOS are generated between adjacent real LOS using sp-lines for interpolation of the measured data. Information on the magnetic equilibrium is further embedded by means of a smoothing operator. This performs a moving window average of the signal from nearby pixels that span 1/10 of each magnetic flux surface. Smoothing is applied every nsmooth iteration. In our reconstruction, nsmooth = 1 or 2, typically.
IV. APPLICATION AT THE JET
As an example of the capabilities of the GCU, we here present data for JET discharge no. 95689 in the time window t = 47.5–52.5 s. The discharge belongs to a series of experiments on the “three ion” Ion Cyclotron Resonance Frequency (ICRF) scenarios,10–12 where radio-frequency (RF) waves are used to accelerate a beam of deuterium ions up to energies in the MeV range and in a plasma made of deuterium and 3He, with relative concentrations of 50% and 25%, respectively. The aim of the experiments was to tailor the D+3He reaction rate by accelerating deuterium at different energies, which is in turn obtained by changes in the ratio between the neutral beam injection (NBI) and ICRH powers.10 The main reaction channel of D+3He is the production of alpha particles and protons, i.e., D+3He → α + p. However, there is also a weaker (≈105 relative probability19) electromagnetic channel of this reaction, D+3He → γ+5Li, which leads to the generation of 16.4 MeV gamma rays and is of interest for the quantification of the fusion power from the D +3He.
Figure 2 shows the gamma-ray spectrum measured by channel 1 (observing the core) and 15 (observing the periphery) of the GCU in discharge no. 95689 and in the time window t = 47.5–52.5 s on a logarithmic scale. Two spectral regions can be clearly distinguished, depending on whether Eγ < 10 MeV or Eγ > 10 MeV. The Eγ < 10 MeV region has a similar shape between the two channels and is dominated by the response function of the LaBr3(Ce) scintillator to neutron background.20,21 In particular, the neutron induced background due to fusion born 14 MeV neutrons has been characterized in Ref. 21 and extends up to approximately 10 MeV. An experimental estimate of such a background for channels 1 and 15 is shown by the red triangles in Fig. 2.

Gamma-ray spectrum measured by channel 1 (left) and channel 15 (right) of the gamma-camera in the time interval t = 47.5–52.5 s of JET pulse no. 95689. For each channel, the neutron induced background is shown by red triangles.
Gamma-ray spectrum measured by channel 1 (left) and channel 15 (right) of the gamma-camera in the time interval t = 47.5–52.5 s of JET pulse no. 95689. For each channel, the neutron induced background is shown by red triangles.
The Eγ > 10 MeV region is significantly different between the two channels. There are almost no events for the peripheral channel 1, while there is a clear structure for channel 15 that exceeds the neutron background. From comparison with the spectrum measured by the tangential LaBr3 spectrometers (see Ref. 22), we find that this structure is due to the 16.4 MeV gamma rays. We also note that the end point energy of the D+3He gamma-ray emission in Fig. 2 is 10% lower than expected, while the 95% confidence band of the calibration, shown in Fig. 1, accounts only for a 5% discrepancy. This suggests that the quadratic polynomial used for calibration under-corrects the non-linearity of SiPMs in this energy region.
The shape of the structure in Fig. 2 is predominantly determined by the dominant Compton interactions of 16.4 MeV gamma rays with the detector,23 combined with the natural broadening of the emission due to the ≈1.5 MeV mass broadening of the unstable 5Li nucleus.24 The average counting rate in the energy band Eγ > 10 MeV is about 30 Hz for channel 15, while this is almost null for channel 1 as shown in Fig. 3.

Counting rate in the energy window Eγ > 10 MeV measured by channels 1 and 15 of the GCU during JET discharge no. 95689.
Counting rate in the energy window Eγ > 10 MeV measured by channels 1 and 15 of the GCU during JET discharge no. 95689.
From the energy spectrum measured at each channel of the GCU, we can integrate data in the region Eγ > 10 MeV to obtain the experimental gamma-ray profile of 16.4 MeV gamma rays from the D +3He → γ + 5Li reaction19 shown in Fig. 4. After tomographic inversion of these data (see Sec. III), we finally obtain the spatial map of the 16.4 MeV gamma-ray emission, shown in Fig. 5. As 16.4 MeV gamma rays are born from the fusion reaction of D and 3He, which also leads to alpha particle production at an ≈105 more abundant rate, the map of Fig. 5 is also an image of the alpha particle source in the experiment. We note that, as expected from theory, alpha particle production occurs in an ≈40 cm narrow region around the magnetic axis, which is found at R ≈ 3 m and z ≈ 30 cm in this discharge. This is also the volume where most of the ICRH power is absorbed by the NBI deuterons according to RF simulations.10 Finally, Fig. 4 shows good agreement between the experimental gamma-ray profile and its reconstruction, which has been obtained by multiplying the weight matrix with the spatial profile data of Fig. 5. The corresponding p-value of the Pearson χ2 test is 0.55.
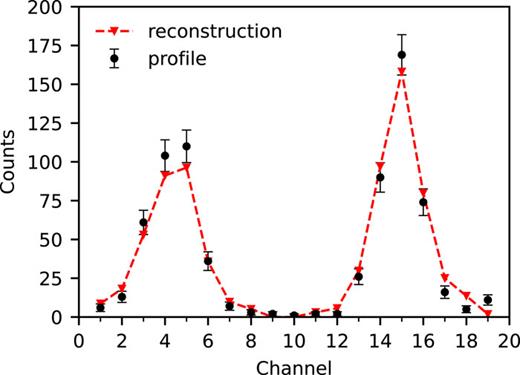
Gamma-ray profile measured by the GCU for discharge no. 95689 and obtained by integrating data in the energy band Eγ > 10 MeV for each channel and in the time window t = 47.5–51.5 s (circular marker); reconstruction of the measured profile obtained convolving the emissivity distribution shown in Fig. 5 with the probability matrix (dashed line).
Gamma-ray profile measured by the GCU for discharge no. 95689 and obtained by integrating data in the energy band Eγ > 10 MeV for each channel and in the time window t = 47.5–51.5 s (circular marker); reconstruction of the measured profile obtained convolving the emissivity distribution shown in Fig. 5 with the probability matrix (dashed line).

Spatial profile of the Eγ = 16.4 MeV emission from the D+3He → γ +5Li reaction in the poloidal plane obtained by a tomographic inversion of the data shown in Fig. 4. GCU channel numbering is shown in white.
Spatial profile of the Eγ = 16.4 MeV emission from the D+3He → γ +5Li reaction in the poloidal plane obtained by a tomographic inversion of the data shown in Fig. 4. GCU channel numbering is shown in white.
V. CONCLUSIONS
The gamma-ray camera upgrade (GCU) has been used in the most recent JET deuterium and hydrogen experimental campaigns. Benefiting from new gamma-ray detectors, which add spectroscopic and MHz counting rate capabilities to the previously existing system, the pulse height spectrum due to gamma-ray emission from fast ion reactions in the plasma was successfully collected for each channel of the system. An Am–Be radioactive source was used for the energy calibration and, in particular, to correct for the detector non-linearity at energies of a few MeV. The application of the system to recent ion cyclotron resonance heating experiments on the three-ion scenario in D–3He plasmas allowed determining an image of the alpha particle source born from D + 3He fusion reactions in these experiments, after a tomographic inversion. The analysis of the recorded spectra shows that the extrapolation of the GCU calibration above 10 MeV underestimates the energy of the D +3He → γ+5Li 16.4 MeV peak by approximately 10%. During recent experiments, lines from 3He + 9Be reactions, which extend up to about 9 MeV, have been observed and might be used to improve the instrument calibration. However, the current calibration is robust in the energy region around 4.4 MeV, which is of interest for the study of α-particles in the upcoming DT campaign.
AUTHORS’ CONTRIBUTIONS
D.R. and E.P. contributed equally to this work, and as such, they must both be considered as first authors.
ACKNOWLEDGMENTS
This work was carried out within the framework of the EUROfusion Consortium and received funding from the Euratom research and training program 2014–2018 and 2019–2020 under Grant Agreement No. 633053. The views and opinions expressed herein do not necessarily reflect those of the European Commission.
This scientific work was also supported by the Polish Ministry of Science and Higher Education within the framework of the scientific financial resources in the years 2015–2020 allocated for the realization of the international co-financed project.
DATA AVAILABILITY
The data that support the findings of this study are available from the corresponding author upon reasonable request.

